Graphicacy as the fourth “ace” with respect to communication and understanding, as in the conveying of information and knowledge. That is, the visual display of information, especially in regards to maps. Cartographic visualisations can be evaluated from different epistemologies.
This model [map communication model], proposed initially by Kola ́cˇny ́, involves a cartographer, separated from the map recipient in time and space, conceptualizing the ‘‘real world’’ to produce a map.
The map-com model was striving for objectivity, truth or reality in maps and was predominant from 1950 - 1980. Newer approaches to mapping focused on cartographic visualization.
Haining, Wise, and Signoretta claim that exploratory spatial data analysis (ESDA) involves only simple and intuitive transformations of data, enabling extraction of information for hypotheses generation and the assessment of statistical models (Haining, Wise, and Signoretta 2000). Dorling and Fairbairn define ‘‘scientific visualization’’ as ‘‘the process of learning through the creation and observation of abstract images, providing a method for seeing the unseen’’ (Dorling and Fairbairn 1997, 102).
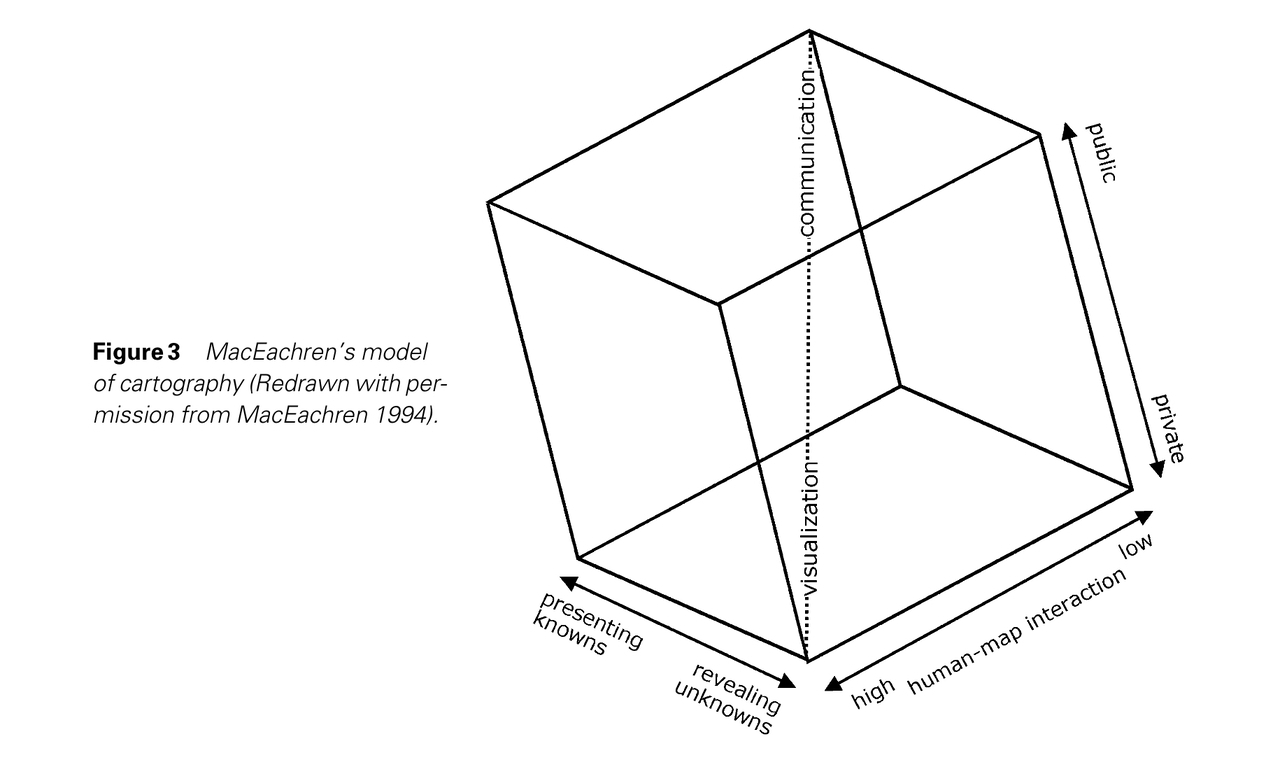
There seems to be a gradient or spectrum between cartography and info-graphics. Generally this model of mapping hovers around “generate hypotheses, develop problem solutions and construct knowledge”. This model got revised in 1994 through the addition of the human-map interaction space.
In this model, three continua exist: (1) the continuum from private realm interaction where individuals explore spatial data to public realm interaction where a wide audience may use a published map, (2) the continuum from spatial data exploration in which the focus is revealing unknowns to map use in which ‘‘knowns’’ are presented, and (3) the continuum from high human-map interaction to low human-map interaction.
Screen
“query, reexpression, multiple views, linked views, animation, and dimensionality” are the basic actions that one can perform on cartographic visualisations.